

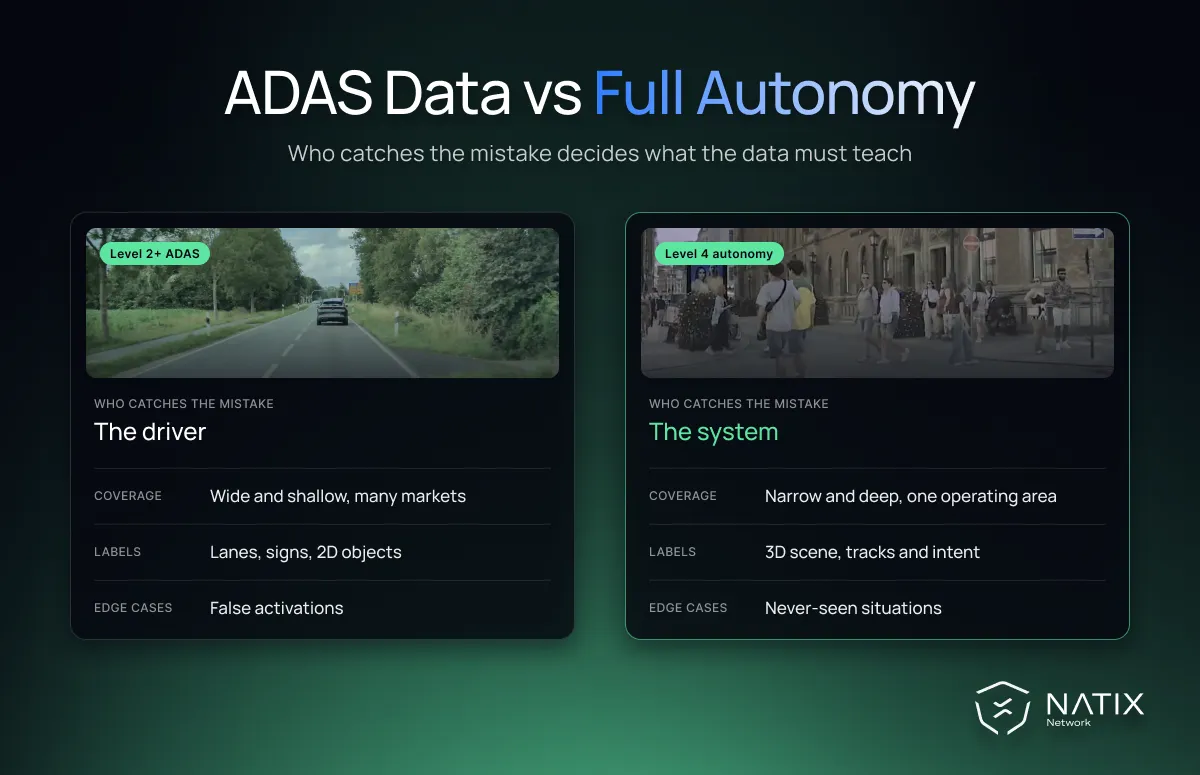
ADAS data and full autonomy data are often bought as if they were the same thing. Most teams ask for "driving data" and expect one dataset to serve a lane-keeping feature and a driverless robotaxi alike. That assumption is understandable, because both systems look at the same roads through similar cameras. Yet a Level 2+ driver assistance system and a Level 4 autonomous vehicle fail in very different ways, so the data that prepares each of them for failure has to be different too.
The central idea of this article is simple: what a model needs from its training data depends on who catches the mistake when the model is wrong. In driver assistance, a human is still responsible and ready to take over. In full autonomy, within its operating area, nobody is. That single difference changes how much of the world the data must cover, how deeply it must be labeled, and how many rare events it must contain.
The industry's shared vocabulary comes from SAE J3016, the standard that defines the levels of driving automation. At Level 2, the system can steer and control speed at the same time, but the driver must supervise continuously. "Level 2+" is not an official SAE level. It is a market term for Level 2 systems with richer features, such as hands-free highway driving or automatic lane changes. In every case, the driver is still the fallback.
Level 4 is a different category of product. The vehicle drives itself within a defined operating area, and it must handle its own failures there. If something goes wrong, the system has to reach a safe state without a human stepping in. A full explanation of each level, and what it means for data, sits in our guide to the SAE levels of autonomous driving.
Regulators already treat the two as separate worlds. In the United States, NHTSA's Standing General Order on crash reporting covers both Level 2 ADAS and automated driving systems. However, it applies stricter reporting criteria to automated driving systems, reflecting their higher level of automation and driverless operation. If the law sees two kinds of risk, it makes sense for engineering teams to see two kinds of data problem.
Think about what each system is really being asked to do. A Level 2+ system is asked to be precise and predictable in common situations. It must keep the lane on a curved highway, hold a safe gap in traffic, and brake for a stopped car ahead. It must also avoid surprising the driver with phantom braking or sudden steering. For this job, ADAS data needs to be very good at the frequent cases and very careful about false alarms.
A Level 4 system is asked to understand an entire scene and plan through it. It must read a construction zone, yield to an ambulance approaching from behind, and handle a pedestrian who hesitates at a crossing. It must do this continuously, because there is no human to hand control back to. For this job, the data must teach judgment in situations that may appear once in thousands of hours.
So the same video clip can be valuable for one system and nearly useless for another. A long, uneventful highway drive helps tune ADAS data for lane keeping and following distance. That same drive adds very little to a robotaxi that operates in a dense city center. The difference is not about quality but about the fit between the data and the job the model must do.
This is why we find it helpful to compare the two along three dimensions. The first is coverage, meaning how much of the world the data represents. The second is labeling depth, meaning how much structure is added to each frame. The third is edge-case density, meaning how often rare and difficult events appear. Each dimension pulls ADAS data and full autonomy data in a different direction.
In short, ADAS data favors breadth, precise object labels and protection against false alarms. Full autonomy data favors depth inside a domain, rich scene structure and a high share of rare events. The sections below take each dimension in turn.
Driver assistance is sold in millions of cars, across many countries and car models. A lane-keeping feature must work on German autobahns, American interstates and Japanese expressways. It must also cope with different lane markings, signs, speed limits and driving habits. For ADAS data, coverage therefore means breadth. The dataset should span many regions, road types, weather conditions and times of day, even if each place appears only briefly.
Full autonomy usually works the other way around. A Level 4 service is deployed in a defined operating area, often one city or one set of routes. The industry calls this the operational design domain (ODD). Inside that domain, the system needs depth. Every intersection, every school zone and every unusual junction should appear many times, in rain and sun, at rush hour and at night.
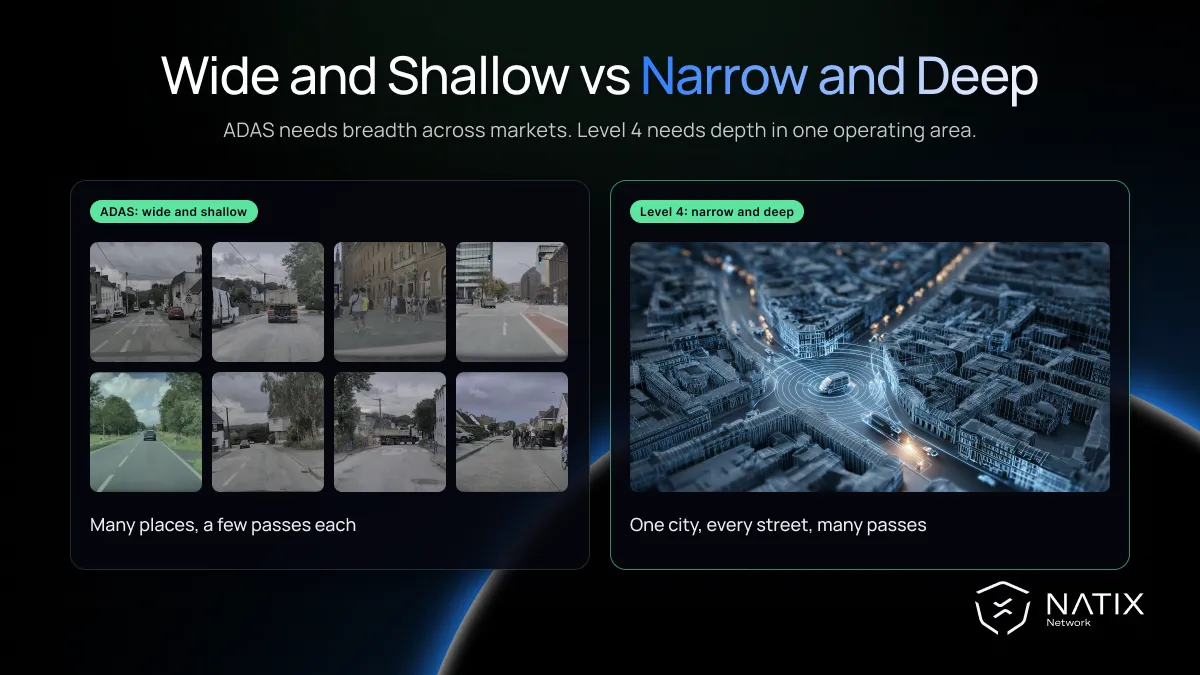
Camera coverage around the vehicle matters as well. Many driver assistance features rely mostly on the forward view, with side sensors for blind spots. A Level 4 system must understand what is happening in every direction at once. For that reason, synchronized multi-camera driving data that covers the whole scene around the vehicle matters most for full autonomy. A single highway feature can often manage with less.
There is a quieter point here too. As driver assistance becomes more capable, its coverage needs start to resemble those of autonomy. Hands-free systems on more road types need more of the surrounding scene. Teams building advanced Level 2+ features should plan their ADAS data as if the system will one day need a wider view.
Regional differences add another layer. Lane markings, sign shapes and road furniture vary from country to country. So do local habits, such as how drivers merge or how close they follow. A feature trained mostly on one market can behave oddly in another. Good ADAS data therefore includes enough examples from each target market to catch these differences before customers do.
Labels tell a model what it is looking at. For classic driver assistance, the most important labels are fairly well defined. These include 2D boxes around vehicles and pedestrians, lane lines, road edges and traffic signs. Each feature can often be trained on its own labeled set. Good ADAS data is consistent and precise on these objects, frame after frame.
A Level 4 system needs much more structure. It must know where objects are in 3D space, how they move over time, and what they are likely to do next. That means tracked identities across frames, trajectories, drivable space and sometimes the intent of other road users. Producing these labels by hand is slow and expensive. That is why careful data annotation for autonomous vehicles has become a discipline of its own.
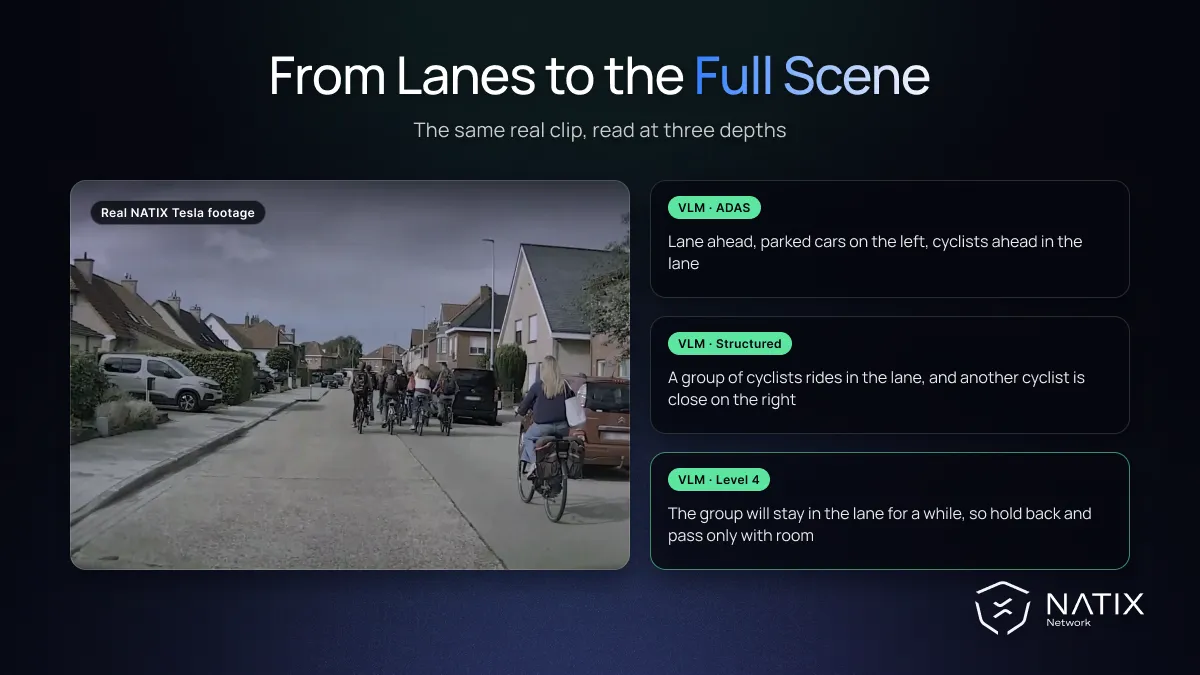
Modern model design is changing this picture in an interesting way. End-to-end driving models learn to map raw video directly to driving behavior. For them, a valuable training signal comes from what the human driver actually did: steering, braking, accelerating and signaling. When video is paired with these driver actions at high frequency, the recorded driving itself becomes a form of supervision. Dense hand labels are still useful, especially for validation, but they are no longer the only path.
Automation is also changing how labels are produced. Auto-labeling pipelines use large models to draft labels, which humans then review and correct. This works well for frequent objects such as cars and lane lines, where ADAS data is plentiful. It works less well for unusual scenes, where the labeling model has little to learn from. The rarer the event, the more human attention it still needs.
For teams sourcing ADAS data, the practical question is which labels the feature truly needs. For teams building full autonomy, the question is broader. They need to know whether the data carries enough structure to teach the model about the whole scene. That structure can come from labels, from synchronized telemetry, or from both.
Every driving dataset is dominated by ordinary moments. Most hours of footage show traffic flowing normally, with nothing unusual happening. The events that decide whether a system is safe are rare by definition. They include debris on the road, a cyclist swerving, emergency vehicles, temporary signs and police directing traffic by hand.
The scale of the challenge is well documented. A RAND Corporation study, Driving to Safety, estimated that proving safety through miles driven alone could require hundreds of millions to billions of miles. Even the most advanced operators show how much driving is involved: Waymo reports 220.6 million rider-only miles through March 2026 on its safety impact hub. Few teams can collect anything close to that on their own.

What counts as an edge case also differs between the two systems. For driver assistance, the most damaging edge cases in ADAS data are often false activations. A shadow, a bridge or a parked truck can trigger phantom braking and erode driver trust. For full autonomy, the dangerous cases sit much deeper in the tail. These are situations the system has never seen and must still resolve without help. We explore how teams define and mine these edge case scenarios in a separate guide.
The implication for sourcing is clear. A Level 4 team should judge a dataset less by its total hours and more by how many relevant rare events it contains. It also matters how easily those events can be found. With VLMs, NATIX can tag scenes in plain language, which makes that density visible before anyone signs a contract. Our openly shared edge-case driving dataset is one example of what this looks like in practice.
Simulation has become an essential part of autonomy development. It can create thousands of variations of a dangerous scenario that would be impossible or unethical to stage on a real road. It is especially good for testing how a planner reacts when one parameter changes, such as the speed of a crossing pedestrian. For both ADAS data and full autonomy pipelines, synthetic scenes help fill specific gaps. A team might, for example, simulate a child running between parked cars at many speeds and angles. That kind of variation is very hard to collect on public roads.
Simulation also has limits that matter more as autonomy increases. A simulator only contains what its designers thought to include. It cannot fully reproduce the true mix of situations, behaviors and visual details found on real roads. The gap between simulated and real performance is a known risk. We compare the two approaches in more detail in our article on synthetic data vs real data.
In practice, the strongest teams use synthetic data to explore variations and real-world data to anchor the distribution. Real footage is also the basis for proving that a system works, which we discuss in our guide to autonomous driving validation data. The higher the level of autonomy, the more weight that real-world evidence has to carry.
Training data teaches a model. Validation data proves that the model is ready for the road. The two overlap, but they answer different questions, and the gap between them grows with the level of automation.
For driver assistance, validation often focuses on defined test cases. Teams check that a feature activates when it should and stays quiet when it should not. Consumer test programs and regulations set many of these scenarios, so ADAS data for validation can be organized around a known catalog. The driver remains responsible, which keeps the scope of each test manageable.
For full autonomy, the question becomes much harder. A Level 4 system must show that it behaves safely across its whole operating area, including situations nobody wrote into a test plan. That requires large volumes of held-out real-world driving, chosen to reflect the true mix of conditions in the domain. It also requires rare events that the system has not seen during training.
The practical lesson is to keep validation data separate from training data from the start. Teams that mix them end up measuring how well a model remembers, rather than how well it generalizes. This matters for any ADAS dataset, but it becomes critical once no human is watching the road.
Putting these ideas together gives two different shopping lists for ADAS data and autonomy data. Neither is complete for every program, but both reflect where the real bottlenecks tend to appear.
Teams building Level 2+ driver assistance should prioritize:
Teams building Level 4 autonomy should prioritize:
This is where NATIX sits in the stack. Our network collects real-world multi-camera footage from the factory cameras of Tesla cars driven by everyday drivers across the USA, Europe and Japan. It now holds more than 220,000 hours of video, with steering, braking and other driver actions recorded at 30 to 36 Hz. The data is camera-only, so it does not replace a team's own sensor fleet. Instead, it works as a scale and long-tail layer on top of it. Teams evaluating options can start with our autonomous driving data sample, then scope a pilot.
The same data is already being used for very different goals. Valeo is building an open multi-camera world foundation model with NATIX data. Autoware uses it for an open-source end-to-end driving stack. Those are two different problems, and they draw on the dataset in different ways. That is exactly the point: good autonomous vehicle training data is not one product but a source that can be cut to fit the job.
Partly. The same raw footage can feed both programs, but the way it is selected, labeled and balanced should differ. An ADAS team will sample broadly and label objects precisely. A Level 4 team will concentrate on its domain and mine the rare events. Treating one ADAS dataset as a complete autonomy dataset usually leaves gaps in the long tail.
Not on its own. Hours of ordinary highway driving add little once a model handles that case well. What improves a system is data that covers the situations where it is still weak. For full autonomy, that usually means more rare events rather than more total hours.
Increasingly, yes. Early driver assistance relied mainly on a forward camera. Hands-free features, automatic lane changes and urban assistance all need a wider view of the scene. As Level 2+ features grow, their ADAS data needs move closer to those of full autonomy.
The difference between driver assistance and full autonomy is not only a matter of capability. It is a matter of responsibility. When a human remains the fallback, the data must make the system precise, predictable and trusted on common roads. When the system becomes its own fallback, the data must cover its domain deeply. It must also expose the system to the rare events it cannot afford to miss.
In the end, ADAS data and full autonomy data answer different questions about the same world. Teams that choose their datasets with that difference in mind will collect fewer of the wrong miles. They will spend more of their time teaching their systems what actually matters.


